Posts

Showing posts from 2020

Never Chase Stocks

Image
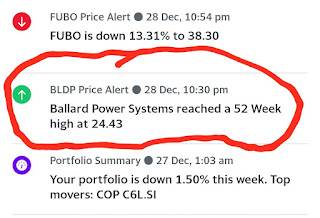
Never Chase a stock that has peaked. Today, impulse and fomo took over me. Queued to buy BLDP at US$23.90... the support level... Done! Lost some money. Let's be disciplined and stick to my checklist.  Rookie Daily (Not Day) Trader premarket Checklist: 8.30am NY time: Watch TraderTV Live ... get stock hints... get the feel... 3 hours. Check MarketWatch Premarket Leaders ... pick and analyze rising stocks. Check Yahoo Finance Earnings Calendar ... pick stocks that have not jumped. Check Mergers and Acquisitions at MarketWatch , Reuters , and CNBC . Strategy formed from real life lessons: Trust Supertrend... Ignore the news analysis (remember the missed Tilray stock that went up 26% in a day) Buy on Supertrend Buy signal (remember the missed opportunities in the buy watch list) Sell on Supertrend Sell signal for losing stocks (remember the gradual -30% Nikola drop) Sell losing stocks to keep cash rolling. It's better than missing opportunities without funds. Just buy whatever hun

Find spiking penny stocks using reverse split strategy

Image
How to find spiking penny stocks using reverse split strategy... Thanks to Humbled Trader ... https://youtu.be/vJ5AgtHNnCY Here's what's I learned... - Small stocks want to stay listed on Nasdaq.  - So they reverse split to reduce their share price.   - They release PR after the reverse split is finished!  - Humbled Trader uses Benzinga pro to screen for recent reverse split stocks that released PR. - Search headline keywords such as "reverse split", "delisting", and "offering".  - There's plenty of money to be made by waking up early.  - Benzinga Pro sends live email alerts whenever the penny stocks Humbled Trader is tracking release a PR headline, files SEC filing, etc. - So Humbled Trader knows what to do when she sees volume trading above average premarket on $VIVE.  - She knows the support to buy the dips and sell at highs near premarket before dilution happens at the opening spike. ~ The rookie trader PS: Is this a reverse stock

Live Day Trading the US Stock Market

Image
I watched these guys' day trade the US stock market live on YouTube. What did I learn? 1. They talk non-stop.  2. They track the news.  3. They watch the premarket.  4. They show their trades. 5. They announce both their wins and losses. 6. They talk about missed trades (Tilray) without emotion.  7. They talk about selling too early but feeling ok because they are following their rules.  What might not work for me? I'm not a day trader but a daily trader. Still, there is something to learn.  I will be watching these day traders again... Coz they might be doing the homework for me.  That's TraderTV Live...  https://m.youtube.com/watch?v=7IqkUKdKKis ~ the rookie trader PS: What happened? - Boring day. What worked? Why? - RIG up 6.20% but the overall gain is only 2.80%. There isn't any news. What did not work? Why? - Latest stock (AG) in but watch list went up (+4.88%) while holding stocks go down.  What did you learn? - I could have just bought it... If only my funds were

Fibonacci Pivot Point Trading Strategy

Image
How to use pivot points indicator for stock trading? Standard or Fibonacci? How to determine entry and exit points? I found this very useful tutorial which I'll be viewing over and over again, till I master the strategy. https://youtu.be/bkSS_kPCctQ Standard of Fibonacci? - Fibonacci is recommended.  What can Fibonacci Pivot Point indicator be used for? - Determine the entry and exit points.  - Confirm a bullish or bearish trend.  How to determine the trend? - When prices are below the pivot point, it is bearish.  - When prices are above the pivot point, it is bullish.  How to determine the buy point? - In a bullish trend, buy when the price touches the centre pivot point, and target the sell when the price reaches R1 or R2. R1 and R2 are the resistance lines above. - In a bearish trend, sell when the price touches the centre pivot point, and target to buy when the price reaches S1 or S2. S1 and S2 are the support lines below. What other indicators work well with Fibonacci Pivot Po

2 High Yield Dividend Stocks To Buy

Image
Here are two high-yield dividend stocks to buy discovered by motley fool. 1. Enterprise Products Partner - NYSE EPD - 10% yield  2. Medical Properties Trust - NYSE MPW - 6.2% yield   https://www.fool.com/investing/2020/10/31/2-high-yield-dividend-stocks-id-buy-right-now/

3 Supertrend Technique

Image
Watching this video again and learning more details about using Supertrend indicators. https://youtu.be/qMuWo9nvK The 3 supertrend setups... - 7,3 - 10,3 - 11,2 How to use... 1. Wait for 3 red or 3 green supertrend to form.  2. Long or short on the 3rd Supertrend after candlestick closes.  3. Exit when the price touches the supertrend line. Which time frame to use? - Intraday trading - 5, 10, 15 min - toggle among all 3 to confirm a signal.  Let's try it. - the rookie trader

Buy Uber?

Image
 Buy Uber at $35.50? 1. Green super trend.  2. 2nd pullback.  3. High obv.   Plus positive premarket. - the rookie trader

Buy Starbucks?

Image
Buy Starbucks at $88.65? 1. The First green super trend has appeared.  2. The first pullback after the super trend signal has appeared. 3. Positive earnings news... https://www.fool.com/investing/2020/10/23/3-things-youll-want-to-know-when-starbucks-announc/ Overall market sentiment is down today though. - The rookie trader

Buy Pfizer?

Buy Pfizer? 1. Second green supertrend. 2. First pullback from supertrend.  3. Good news... https://www.fool.com/investing/2020/10/24/3-top-growth-stocks-to-buy-before-the-election/

Buy Hyphens Pharma at S$0.415?

Image
 Should I buy Hyphens Pharma at S$0.415? - one green super trend has appeared  - There is the first pullback after the super trend  - Both OBV and price are testing the resistance level... Meaning there might be a breakout upwards  This is a risky one based on technical analysis only. - the rookie trader

On Balance Volume Trading Strategy

Volume  shows crowd sentiment as price bars carve out patterns that predict a bullish or bearish outcome. Volume supporting price action creates  convergence , adding reliability to directional signals. Opposing action creates  divergence , warning that market forces are in conflict, with one side eventually taking control. OBV generates more actionable signals than the green or red volume histograms commonly found at the bottom of  price charts . OBV hits a new high while the price tests resistance: bullish divergence, predicting the price will break  resistance  and surge higher, playing catch-up. The price hits a new high while OBV grinds at or below the last resistance level: bearish divergence, predicting the  rally  will stall or reverse. OBV hits new low while price tests support: bearish divergence, predicting the price will break support and surge lower, playing catch up. The price hits new low while OBV grinds at or above the last support level: bullish divergence, predicting

Staffing 360 Solutions and SPI Energy Stock Spikes

Image
Today's skyrocketing stock... Staffing 360 Solutions... Where's the rumor? Searched Google.  Found this... https://ownsnap.com/rocketing-stock-to-double-your-investments-staffing-360-solutions-staf/ The article was released 1.5 hours before market opened. Let's subscribe to...  https://ownsnap.com/ The second one is SPI Energy. News? ...  https://finance.yahoo.com/news/spi-energy-advances-edisonfuture-electric-083000355.html So, read Yahoo finance. Next action: Read and queue one hour before market opens. 8.00pm sg time.  - the rookie trader.

Buy SXTC at US$0.29?

Image
Should I buy SXTC at US$0.29? 1. It's a stock market rumour . 2. A green supertrend appeared yesterday. 3. It is cheap and has the potential to go to $1. Why not give it a go because there is not much to lose. - the rookie trader PS: I queued for SXTC 1,000 shares at US$0.29.

Where to Find Stock Market Rumors

Image
In the previous post, I learned how to predict stock markets spikes and gaps . One way is to find stock market rumors. I googled for "stock market rumors forum". I found this...  https://stockaholics.net/forums/stock-message-boards-nyse-nasdaq-amex.3/ Then I saw this thread... https://stockaholics.net/threads/chinese-pharmaceuticals-symbol-sxtc-going-hard-bull.10908/ Someone is trying to start a rumor about SXTC. I checked the stock and it seems to be valid, but it looks like it has already spiked... A small spike though... So it's worth a try... After all it's a penny stock. Should I buy SXTC at 29 cents? - the Rookie Trader Journal

How To Predict Stock Spikes

Image
I noticed most top 30% NASDAQ gainers open with huge spikes of big gaps. The question is... Is there a way to predict these spikes or gaps? I found the answer in this video... Https://youtu.be/lnaFm3-6hWw 1. Get the latest stock market news... Marketwatch.com 2. Search for stock market the rumors. 3. Compare rumors with the news.  We want to find rumors that are backed up with facts and are not yet in the mainstream news. Where to find stock market rumors? - The rookie trader journal

Buy AVI-TECH at S$0.435?

Image
Should I Buy AVI-TECH at S$0.435? Based on experts analysis,  1. The stock is bullish.  2. Target is S$6.00... based on POEMS research. 3. Buying one lot is no problem... Penny stock. Source:  https://www.poems.com.sg/ Should I follow expert analysis? Let's try for 2 to 3 stocks. - the rookie trader Update: I queued for 1,000 shares of AVI-tech at S$0.435... only 400 shares got through.

Buy Bio Key at $0.65?

Image
Should I buy Bio Key at $0.65? - top 30 gainer today - green supertrend - day and week - gap up Let's queue. The rookie trader

Buy SATS at S$3.06?

Image
Should I buy SATS at S$3.06? - the second daily green supertrend is triggered.  - coincides with the weekly green supertrend.  - good news for the airline industry...  https://www.todayonline.com/singapore/govt-doing-its-utmost-support-singapore-airlines-changi-airport-group-through-deep-crisis Keep if it goes the other way... Long term wise it will go up... Within 2 years... Plus earn dividends if any.  The rookie trader

Super Trend Alert Notification

Image
Is there a program that scans every stock in the market and alerts me or notifies me when a super trend indicator appears? I found one but it's a stock by stock setting...  https://wiki.timetotrade.com/Super_Trend_Alerts I may not use it because it does not scan every stock, but the trigger settings are some things I can Leann from. Let's hunt for my alerts... Or write my own app. The rookie trader journal

Sell Suntec Reit at S$1.47?

Image
 Should I sell Suntec Reit at S$1.47? 1. Sell supertrend signal appeared yesterday. 2. The first pullback after supertrend occurred today. 3. Sell while I'm still in profit. I queued yesterday at S$1.46 but it wasn't done. Hopefully I can catch it today at S$1.47. ~ The Rookie Trader Journal.

Buy Olam at S$1.26?

Image
Should I buy Olam at S$1.26? Why? 1. Green Supertrend signal appears. 2. First pullback after supertrend. 3. No bad news about Olam, only good. Let's place order. The rookie trader journal

Listed Fintech Companies In Singapore

Image
Which are the top 3 fintech companies listed in the Singapore stock exchange? 1. iFast 2. Silver Lake 3. Synagie Fintech is definitely a rising industry.  Should I invest in them all? Source:  https://www.sgx.com/research-education/market-updates/20200717-singapores-fast-growing-fintech-sector

Buy Creative, Frencken, and Silverlake?

Image
What to buy today? Check the signals from green Supertrends. Hence I queued for these stocks.  - All for short-term trading - Potential to earn about $100 or less - Prepare to let go when red Supertrend appears What do you think? The Rookie Trader

Supertrend Back Testing Results

Image
I found this very encouraging result for a rookie like me... - more losing trades than winning trades - profit doubles anyway - so just stick with one strategy long term https://youtu.be/AIZIHt45u2w

How To Forecast Sideways Market

  In order to successfully identify a sideways trading market, you will have to first find the levels of support and resistance. These two levels are virtual lines on the chart that seem to contain the price movement. When the chart reaches resistance it bounces down, and when it reaches support — up. -  https://paxforex.com/forex-blog/how-predict-sideways-market

What can I buy today?

Image
Based on Supertrend signals and potential upswing, I found the following stocks.  Potential US stocks to buy... - UAL US$37.40 - BAC US$25.66 Potential SG stocks to buy... - UG Healthcare S$2.64 The rookie trader journal

Money Flow Index Strategy

  What Does the Money Flow Index Tell You? One of the primary ways to use the Money Flow Index is when there is a  divergence . A divergence is when the oscillator is moving in the opposite direction of price. This is a signal of a potential reversal in the prevailing price trend. For example, a very high Money Flow Index that begins to fall below a reading of 80 while the underlying security continues to climb is a price reversal signal to the downside. Conversely, a very low MFI reading that climbs above a reading of 20 while the underlying security continues to sell off is a price reversal signal to the upside. Source:  https://www.investopedia.com/terms/m/mfi.asp

Buy Silverlake at S$0.31?

Image
 Should I Buy Silverlake at S$0.31? 1. Supertrend buy signal 2. First pull back after Supertrend  3. Promising fintech company  Beware though, this is a recommendation by someone through a friend.

Buy SBS at S$2.87?

Image
Should I Buy SBS at S$2.87? 1. Green Supertrend signal 2. Bullish RSI 3. Potential to go up after Covid. What do you think? News 2 weeks ago... SBS Transit: The transport operator saw its net profit fall 27.4 per cent to S$32.6 million for the half year ended June 30, as the use of public transport declined during the novel coronavirus pandemic. Revenue fell 14.9 per cent amid lower rail ridership. Before the results were released, SBS Transit shares moved up S$0.03 or 1.1 per cent to close at S$2.82 on Thursday... https://www.businesstimes.com.sg/stocks/stocks-to-watch-st-engineering-ocbc-golden-agri-uol-sbs-transit-rex  

CDP Two New E-services

FROM 1 September 2020, the Central Depository (CDP) rolls out two new online services. 1. S ubmission of election instruction for scrip dividend election, dividend currency election and takeover acceptance events through the Singapore Exchange (SGX) investor portal. 2. C ash distributions to be credited directly into investors' designated bank accounts via the CDP's free direct crediting service (DCS). Three other existing online services include... - currency conversion service,  - viewing of one's CDP portfolio on the SGX mobile application, and -  using PayNow to submit and pay for rights subscription. Oh great! I can use PayNow to submit and pay for rights subscription via CDP. Source: https://www.businesstimes.com.sg/companies-markets/cdp-offers-investors-two-new-e-services-from-sept-1 Rookie Trader Journal

Sembcorp Marine Rights Issue - What to do?

I have 3 options:  do nothing  sell the rights  subscribe  1. Do Nothing There is no cash outlay but if I let the rights lapse  I will then see my  stake diluted when the exercise is completed. 2. Sell the rights I can sell their rights in the market, so this option results in cash inflow .  The rights appear on the Singapore Exchange's website as "Sembcorp Marine R". https://sg.finance.yahoo.com/quote/THFR.SI?p=THFR.SI&.tsrc=fin-srch As the rights have an expiry date, the value of the rights will fall closer to the expiry date. 3. Subscribe This involves cash outflow and would entail paying SMM S$1 to get five new shares for each share currently held. This option would be suitable if I have faith in SMM's long-term future. Which should I choose? I want liquid cash to buy other stocks. So maybe I should sell the rights. In that case I must subscribe first! It might not be a good idea to throw good money after bad. Shareholders may wish to think twice before subs

Buy American Airlines at US$13.44?

Image
 Should I Buy American Airlines at US$13.44? 1. One green Supertrend. 2. RSI bullish. 3. The airline industry will bounce back fast. This is promising.

Buy Biolidics at S$0.425?

Image
 Should I Buy Biolidics at S$0.425? 1. Second green Supertrend appears 2. RSI bearish 3. Medical stock It's only 43 cents. No need to think so much. Source:  https://sg.finance.yahoo.com/chart/8YY.SI

7 things about trading US stocks in Singapore

 7 things I need to know to trade the US stock market from Singapore. Why trade US stocks? US stocks can offer higher growth potential than Singapore-listed ones. What are the 3 indices available? S&P 500 Index, Dow Jones Industrial Average, and NASDAQ Composite Index. What time does the US market open and close? 9.30 am Eastern Time (ET) to 4 pm ET from Monday to Friday. In Singapore time, it’s 9.30 pm or 10.30 pm to 4 am or 5 am (depending on daylight savings).  What is the minimum number of shares I can buy from the US stock market? 1 share. In Singapore, it's a minimum of 100 shares. Which is the best US stock market broker on top of low commissions? Check the review list...   https://seedly.sg/reviews/online-brokerages Must I pay tax for dividends and earnings? Yes, there are  taxes involved when investing in US shares  as a Singaporean.  Investors need to take note of withholding tax for dividends, currency conversion fees, and US estate tax.  How to research US sto

Buy ST Eng at S$3.42?

Image
Should I Buy ST Eng at S$3.42?  1. The second green Supertrend appears. 2. The first pullback after a Supertrend. 3. A tech stock that hasn't gone up yet. If things go wrong, can hold for the long term. Source:  https://sg.finance.yahoo.com/chart/S63.SI

Lesson: Stop Using RSI, a Supertrend is a Super Trend

Image
 If we were to follow the RSI signals, no one would have profited from this Medtecs spike. 1. The trend is caused by the news. 2. You can still buy if the green Supertrend is at the peak price. 3. RSI show overbought, yet bullish, which has no meaning. Come to worse, cut loss when the red Supertrend appears. Source:  https://sg.finance.yahoo.com/chart/546.SI

Buy SIA Eng at S$1.87?

Image
 Should I Buy SIA Eng at S$1.87? 1. Third Green Supertrend. 2. The first pullback after 3rd Supertrend. 3. Potential uptrend as the aviation industry evolves to survive. Buy and hold for the long term. Source:  https://sg.finance.yahoo.com/chart/S59.SI

How to use pivot point in trading

Image
What are pivot points? How can you use support and resistance levels within a pivot point Indicator? What types of pivot points are there? How do you use pivot points?  

Buy ST Eng at S$3.45?

Image
 Should I Buy ST Eng at S$3.45? 1. RSI is highly bullish. 2. Second Green Supertrend. 3. Tech stock. Source:  https://sg.finance.yahoo.com/chart/S63.SI

How to use RSI indicator

Apply RSI 5 and RSI 14 Apply a short 5 period RSI (RSI 5) over the longer (default) 14 period RSI (RSI 14) and watch for crossovers.  With the RSI 14, there are times when the market does not reach the oversold or overbought levels before a shifting direction occurs.  A shorter period RSI is more reactive to recent price changes, so it can show early signs of reversals.  Buy Signal When the RSI 5 crosses above the RSI 14, it means that recent prices are getting higher. A buy signal is then generated, and a 5 vs. 14 cross should happen when the 5 period (blue) is oversold (below 30).  Sell Signal When the RSI 5 crosses below and becomes lower than the RSI 14, it means that recent prices are declining.  This is a sell signal. A 5 vs. 14 cross should occur when the 5 period (blue) is overbought (above 80).  Works well with Pivot Points Experienced traders may find that their trading performance greatly benefits from combining a RSI trading strategy with  Pivot Points . Source:  https://ad

Buy Genting Sing at S$0.69?

Image
 Should I Buy Genting Sing at S$0.69? 1. RSI bullish. 2. First Supertrend pullback. 3. Potential up spike after the covid19 vaccine. Source:  https://sg.finance.yahoo.com/chart/G13.SI