Reading Stock Chart Patterns - Rookie Swing Trader Journal July 27, 2021
Yesterday, I start studying swing trading from scratch here... https://www.swing-trade-stocks.com/swing-trading-basics.html
This is what I learned and this will be my new strategy.
- 4 Stages - There are 4 stock market stages. Bottom, uptrend, top, and downtrend
- 5 Waves - There are 5 uptrend Elliott waves and 3 correction waves. Buy on wave 2. Hold on Wave 3. Sell on wave 4.
- Trends - Trade trending stocks. Characterized by higher highs and higher lows.
- Identify a new trend using Trader Vic's 3-step method. 1. A trendline is broken. 2. There is a retest and failure. 3. Price falls below the prior low. Use the 10 (SMA) and 30 (EMA) period moving average crossover scan for step 2. Step 3 confirms trend change. Does not work in a sideways trading range.
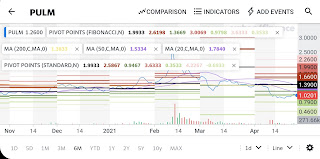
- Bulls and Bear - The 200 SMA is used to separate bull territory from bear territory.
- Support and Resistance - Stocks do not find support or run into resistance on moving averages. Stocks to reverse that price level.
- The more times a stock hits a support or resistance area the weaker it becomes (and the possibility of a breakout increases).
- Buy at support. Sell at resistance.
- Volume? Not important?
- THERE IS NOTHING ON A CHART THAT MATTERS MORE THAN PRICE. EVERYTHING ELSE IS SECONDARY.
- Candlesticks - Stocks tend to move in the direction of wide-range candles. Narrow range candles imply low volatility. Enter a stock in periods of low volatility and exit a stock in periods of high volatility.
- Candlestick reversal patterns... https://www.swing-trade-stocks.com/candlestick-patterns.html
- Reading stock charts.
- What stage is this stock in?
- Is this stock in an uptrend or a downtrend?
- Is the stock at the beginning, middle, or end of the trend?
- How strong is the trend?
- Where are the trend lines?
- What wave is this stock in?
- What do the moving averages tell me?
- Was there a breakout recently?
- Is the chart "smooth" or "sloppy"?
- Are there any chart patterns?
- Are there wide-range candles in the direction of the trend?
- Are there any gaps in the direction of the trend?
- Are professionals selling strength or buying weakness?
- Where are the support and resistance areas?
- Is this stock at a Fibonacci level?
- What does volume tell me?
- To be continued...
--------
How's my purchasing power today?
- I can buy 4 stocks using Moomoo.
What stocks to buy from Yahoo Finance Watch List? What stocks to add to the watch list from Yahoo Finance movers-related stocks?
- YF Watch list. None.
- In the YF news. None.
- Related YF trending tickers. None.
- Related YF market movers. None.
Any tips from TraderTV Live?
- Skipped.
Which stock in hand can I sell?
- 12 stuck stocks at FSMone. See Yahoo Finance.
- AAL (mm kdj rsi). Bought $21.30. Stop at $19.60. Target $24.
- GNUS (yf bbl to). Bought (FSMone) $1.65. Target $1.82.
- TNXP (no indicators, gap down). Bought $0.75. Target $0.83.

How to track medical biotech stocks, meme stocks, and penny stocks... As well as any popping stock?
- MOOMOO BUY SELL SIGNALS: (retired strategy)
- Started on 7 June 2021.
- Scan Trade Heat list to look for 3 signals.
- 1st signal - Buy on KDJ Golden Crossing
- 2nd signal - Confirm uptrend with SAR and MA.
- 3rd signal - Double confirm with Oversold Analyses.
- Complement with Bollinger Band Breakout strategy.
- Sell on opposite signals.
- YAHOO FINANCE BUY SIGNAL: (retired strategy)
- Yahoo Finance mover-related stocks.
- Pring KST - Green line crosses above the red line while below 0.
- AND price above 50MA.
- YAHOO FINANCE SELL SIGNAL: (retired strategy)
- Stochastic: The black line crosses below the red line while above 80. (Wrong)
Until tomorrow.
~ The Rookie Trader
PS: I would like to thank the following...
- For the charts... https://finance.yahoo.com/
- For the analysis... https://tradertv.live/
- For all in one... https://j.moomoo.com/005lWj
Buy Crypto? Binance SG.
- ETH-USD $2303
Note to self:
- Buy Market price when I see a signal. Don't buy at a Limit price.
- Buy on dip from late April to early May 2021.
- Sell in May and go away. Reinvest in November.
- August is a particularly strong month, September is an especially bad month for stocks.
- 10% strategy is not efficient. 5% profit is faster to reach. Hence Change to >$100 target strategy instead.
- Buy quickly once I identify a stock to buy.
- Queue GTD for every buys and sells.
- Missed SEAC spike 3 times within a week. Dropped to negative immediately after the spike. Lesson - Queue up to sell using GTD. Forget about using alerts.
- Premarket moves are irrelevant and distracting. Stop tracking them.
- Sell immediately if price spikes on news.
- Remove emotion from the equation.
- Sell. Don't hold. Don't be greedy.
- Sell when the target is hit. Don't hold.
- I need a cut-loss strategy.
- If I don't sell, I will have no capital to buy.
- Locking the profits at hand is better than risking the losing direction.
- How to recover from stock market losses? How to recover my money lost? How to win my trading losses back?
- The best way to recover after losing money in the stock market is to invest again.
- What happened?What worked? Why?What did not work? Why?What did you learn?What can be done better?What will stop you?How to overcome the challenges?


Comments