A Rookie Trader's Journal -
What To Buy? When To Sell?
Where to Stop Loss? How to Let Profits Run?
Buy Starhub at S$1.22
Get link
Facebook
X
Pinterest
Email
Other Apps
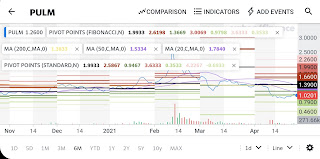
7-day RSI shows oversold buy signal. First supertrend buy signal appears after 3 days. The first pull back may be at S$1.22. Caution though... RSI is already at 53.
1 hour before the market opens... How's my purchasing power today? I can buy 3 stocks. What's SwaggyStocks saying about Wallstreetbets ticker sentiment? Today. MVIS TSLA GME Yesterday. MVIS TSLA GME Are any stocks in my Yahoo Finance watchlist to buy? Biotech stocks Bought all I wanted. SEE BELOW. BUY TSLA at $700? BUY JOB at $0.58? BUY PLAG at $1.93? Any tips from TraderTV Live? Buy on dip from late April to early May 2021. Wow, they are right. Question to self: How to track medical biotech stocks, meme stocks, and penny stocks? Market opens... Which stock in hand can I sell? Bought TNXP for $0.97. Target $1.22. Stop $0.86. Buy HOTH at $1.46? Done. Target $1.72. Stop $1.39. Bought PULM $0.94. Sold at $1.06. What can I buy from yahoo finance trending stocks? Not checking. Coz testing finviz. What can I buy from market movers and related stocks? Not checking. Coz testing finviz. Which sector is the money rotating to ne...
Here’s a trading journal entry for your MSFT trade today. Trading Journal: August 27, 2025 Stock: Microsoft (MSFT) My Plan I was looking at MSFT on the daily chart and saw a few signals that caught my eye. The price is heading towards the lower Bollinger Band, which is around $500, a level that often acts as support. At the same time, the RSI (Relative Strength Index) is at 30. This usually suggests the stock is getting oversold and could be due for a bounce. The OBV (On-Balance Volume) is in the lower half, confirming there's been selling pressure. With the current price at $502.04 and the fair value estimate for the stock being somewhere between $600 and $623, this dip looks like a good buying opportunity to me. My Trades * I placed my first buy order at $501.50 to get in on the potential bounce. * The price continued to drop after that, so I decided to add to my position at a better price. I queued a second buy order on another account at $498. Market News There wasn't an...
SGX may be bouncing back. I'm using the RSI indicator. Mapletree Industrial Trust may be too high. Yes I speak layman language. Capital Land may have hit bottom. I'm reviewing every chart manually. SIA, Sembcorp Marine can buy. Can sell gold. Manual screening is getting exciting. Must find a free software screener. Time to trade in US stock market. Price movement there is faster and bigger. Let's go activate my POEMS US trading account. Adrian's Journal The rookie trader


Comments